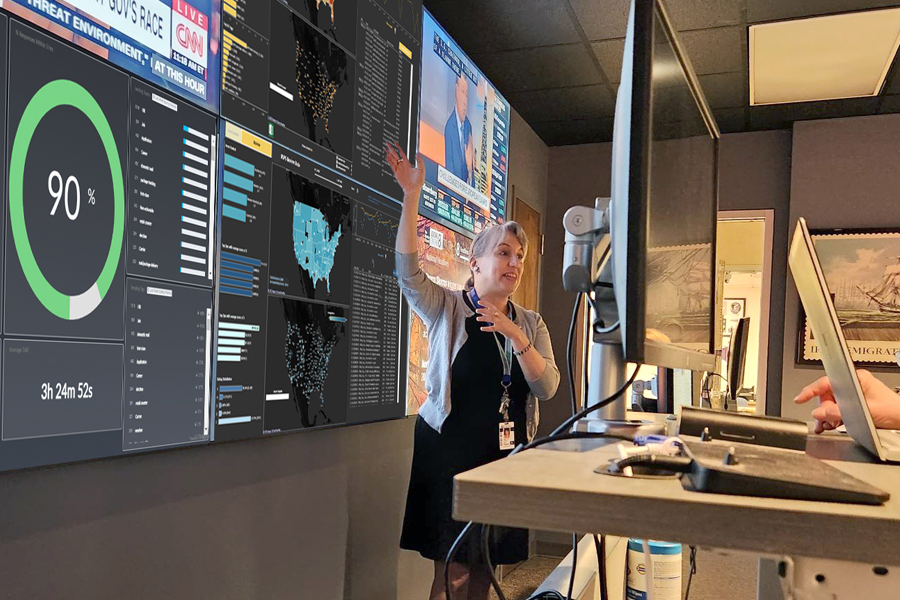
An innovative tool from the USPS Social Business Intelligence team is using social media information to measure customer service satisfaction.
The social media heat map uses the data visualization program Tableau to geographically display comments left on the organization’s official Facebook and Twitter accounts and from online review sites.
Mary Beth Levin, the Postal Service’s social media manager and map creator, came up with the idea of helping people visualize service trends after noticing patterns in social media comments filtering up from the organization’s social media customer response team.
Map information can be categorized by customer concern, and those with map access can view results by area, district and ZIP Code. Field managers can use the data as a customer service performance indicator to identify patterns and make operational improvements.
Between 2019 and 2020, Levin worked with managers in the former South Florida District to target service trouble spots. With the help of the map, the district observed a 31 percent reduction in “Where is my package?” complaints, a 51 percent reduction in Certified Mail exceptions and an 85 percent drop in “Where is my mail?” concerns.
Another advantage of the map is real-time feedback for employees. Unlike with Customer 360 and point-of-sale surveys, customers are providing spontaneous reactions about their experiences in a forum where the public can see it.
“Social media is relevant and needs more focus because these are customers that take their time to comment and are using their voice to share their experience, whether good or bad,” said Torie Miles, the consumer affairs outreach analyst for Southern Area and a map proponent.
Any employee can request access to the heat map by emailing Levin at mary.b.levin@usps.gov, and she hosts a virtual weekly office hour where users can ask questions and share their experiences with using the tool.


